How to backtest a trading strategy
Backtesting means testing a strategy's rules on past prices to see how it would have done. Here is how to do it properly, by hand or automatically, with real numbers from 694 backtests we ran ourselves.
Backtest a strategy free Free plan · No credit card · Runs in your browserWhat backtesting is
Backtesting is testing a trading strategy on past prices. Here is one real day of it.
MNQ, 5-minute, February 4, 2025 · 15-minute opening range breakoutSwipe the chart to see the rest of the day
- 1 The rule marks the range High and low from 09:30 to 09:45
- 2 A close above it is the entry 09:50, stop under the range, target 2R
- 3 Out at 16:00 for +0.85R Neither the stop nor the target was hit
A backtest does this for every day in the test: 1,490 trades from 2020 to 2025, 46.4% won, +157.5% after costs.
Manual and automated backtesting
Two ways to run the same test. Many traders use both.
Manual backtesting
- How it works
- You replay the chart bar by bar with the future hidden, and take each trade by hand
- What you need
- Written rules and a replay tool. No code
- Good for
- Price action and discretionary setups, practicing execution, prop firm practice
- Weak spot
- Slow, so samples stay small, and it is easy to peek ahead without noticing
Automated backtesting
- How it works
- A program applies the rules to years of data in seconds or minutes
- What you need
- Code (Python, Pine Script, MQL or C#), or an AI that writes it from your rules
- Good for
- Rules that can be written exactly, large samples, many markets at once
- Weak spot
- Easy to over-fit, and it tests what the code says, not how you would trade it
How to backtest a trading strategy, step by step
One real example runs through every step: the 15-minute opening range breakout on MNQ, tested on 5-minute charts from 2020 to 2025.
Write the rules down
Entry, exit, stop-loss, take-profit, position size, and when not to trade. If two people can apply your rules to the same chart and get different trades, they are not rules yet.
Example rules 15-minute opening range breakout- Range
- High and low from 09:30 to 09:45 New York time
- Entry
- A candle closes above the high (buy) or below the low (sell)
- Stop
- The other side of the range
- Target
- 2 times the risk
- Exit
- 16:00 at the latest
Pick the market, the timeframe and enough history
Use several years that include trends, ranges, quiet months and wild ones. Aim for at least 100 trades: with fewer, luck can explain almost any result. We do not judge a test with fewer than 100 trades.
What we tested it on- Market
- MNQ (Micro Nasdaq 100)
- Chart
- 5-minute
- Years
- 2020 to 2025
- Costs
- Charged on every trade
Keep the last years unseen
Build and adjust the strategy on one period, then run it once, unchanged, on later years you never looked at. A strategy that only works in the years it was built on was fitted to them.
Build, then check on years it never saw Build 2020 to 2023 Unseen 2024 to 2025 +65.4% profit factor 1.13 · 994 trades +55.7% profit factor 1.20 · 496 tradesHeld up: it made money in the two years it was never tuned on.
Run the test
By hand: start the replay before your first date so the future stays hidden, and log every trade. Automated: code the rules or describe them to an AI, then check a handful of its trades on the chart to be sure it does what you meant.
A manual replayMNQ, 5-minute, February 4, 2025: price broke above the opening range at 09:50. Now decide, and take every trade the rules give you, including the ones you do not like.
Charge the costs
Spread, commission and slippage come off every trade. On short timeframes they decide whether a strategy makes money at all.
What costs took Before costs $89,372 After costs $78,771Costs: $10,601, 12% of the profit, over 1,490 trades.
Read the results, not just the profit
Look at the profit after costs, the profit factor (gross profit divided by gross loss: under 1 loses money), the win rate, the maximum drawdown and the number of trades, then compare it with simply holding the market. Our example won fewer than half its trades and still more than doubled the account, yet holding MNQ made more.
The result, after costs- Return
- +157.5%
- Win rate
- 46.4%
- Profit factor
- 1.16
- Max drawdown
- 15.6%
- Buy and hold
- +190%
Stress it, then trade it small
Shuffle the order of the trades thousands of times (a Monte Carlo test) to see how deep the drawdown could get, try the rules on other markets, then trade them on a demo or a small size before real money.
How deep it could fall In the backtest 15.6% Monte Carlo, worst 5% 30.4%Shuffling the same trades almost doubled the worst drawdown. Size your risk for that, not for the backtest.
What 694 of our own backtests show
We test popular strategies on 1-minute history, after costs, and publish every result. Most of them fail.
- Lost money 460 66%
- Too few trades to judge 48 7%
- Made money overall, lost in one period 93 13%
- Made money in both periods 64 9%
- Passed every check 29 4%
Famous is not the same as profitable
The stochastic crossover (14, 3, 3) lost money in 33 of its 36 tests.
93A profit over all the years is not enough
93 tests made money overall but lost in the build years or in the unseen ones. One test over every year would have called them winners.
46.4%The win rate says little on its own
The opening range breakout won fewer than half its trades and made money in both periods.
Common backtesting mistakes
Looking ahead
Seeing the next candles before you decide. A replay that hides the future is the fix.
Over-fitting
Tuning settings until the past looks perfect. Keep the last years unseen and test them once.
Too few trades
Ten great trades prove nothing. Wait for at least 100.
No costs
A strategy that wins small and often can lose everything to the spread.
Cherry-picking
Reporting the one market or timeframe that worked. Keep every test, losers included.
Skipping trades
Taking only the setups you like in a manual test. The rules decide, not the mood.
How to backtest in BacktestingMax
Both ways in one app, in your browser.
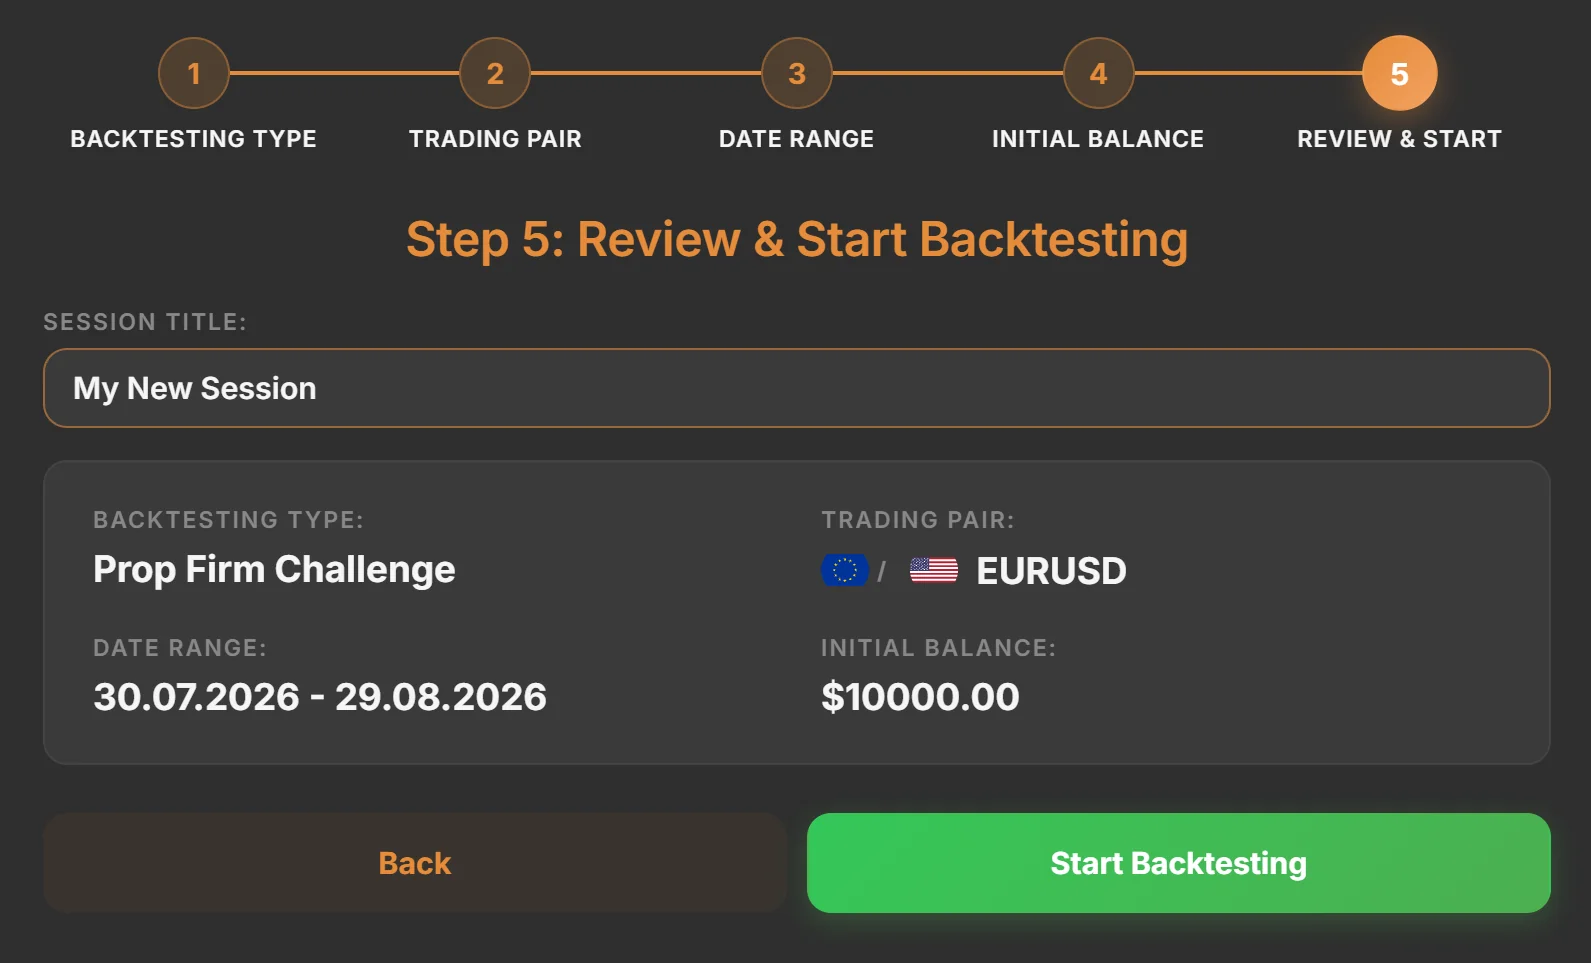 By hand
Replay the chart with the future hidden
Pick a market and a start date. The chart opens on the bars before it, and nothing after it shows until you press Play. Trade the replay with stops, targets and costs, and every trade lands in your stats.
- Play, pause or step one bar at a time
- Down to 1-second candles on Pro
- Prop firm rules if you are practicing a challenge
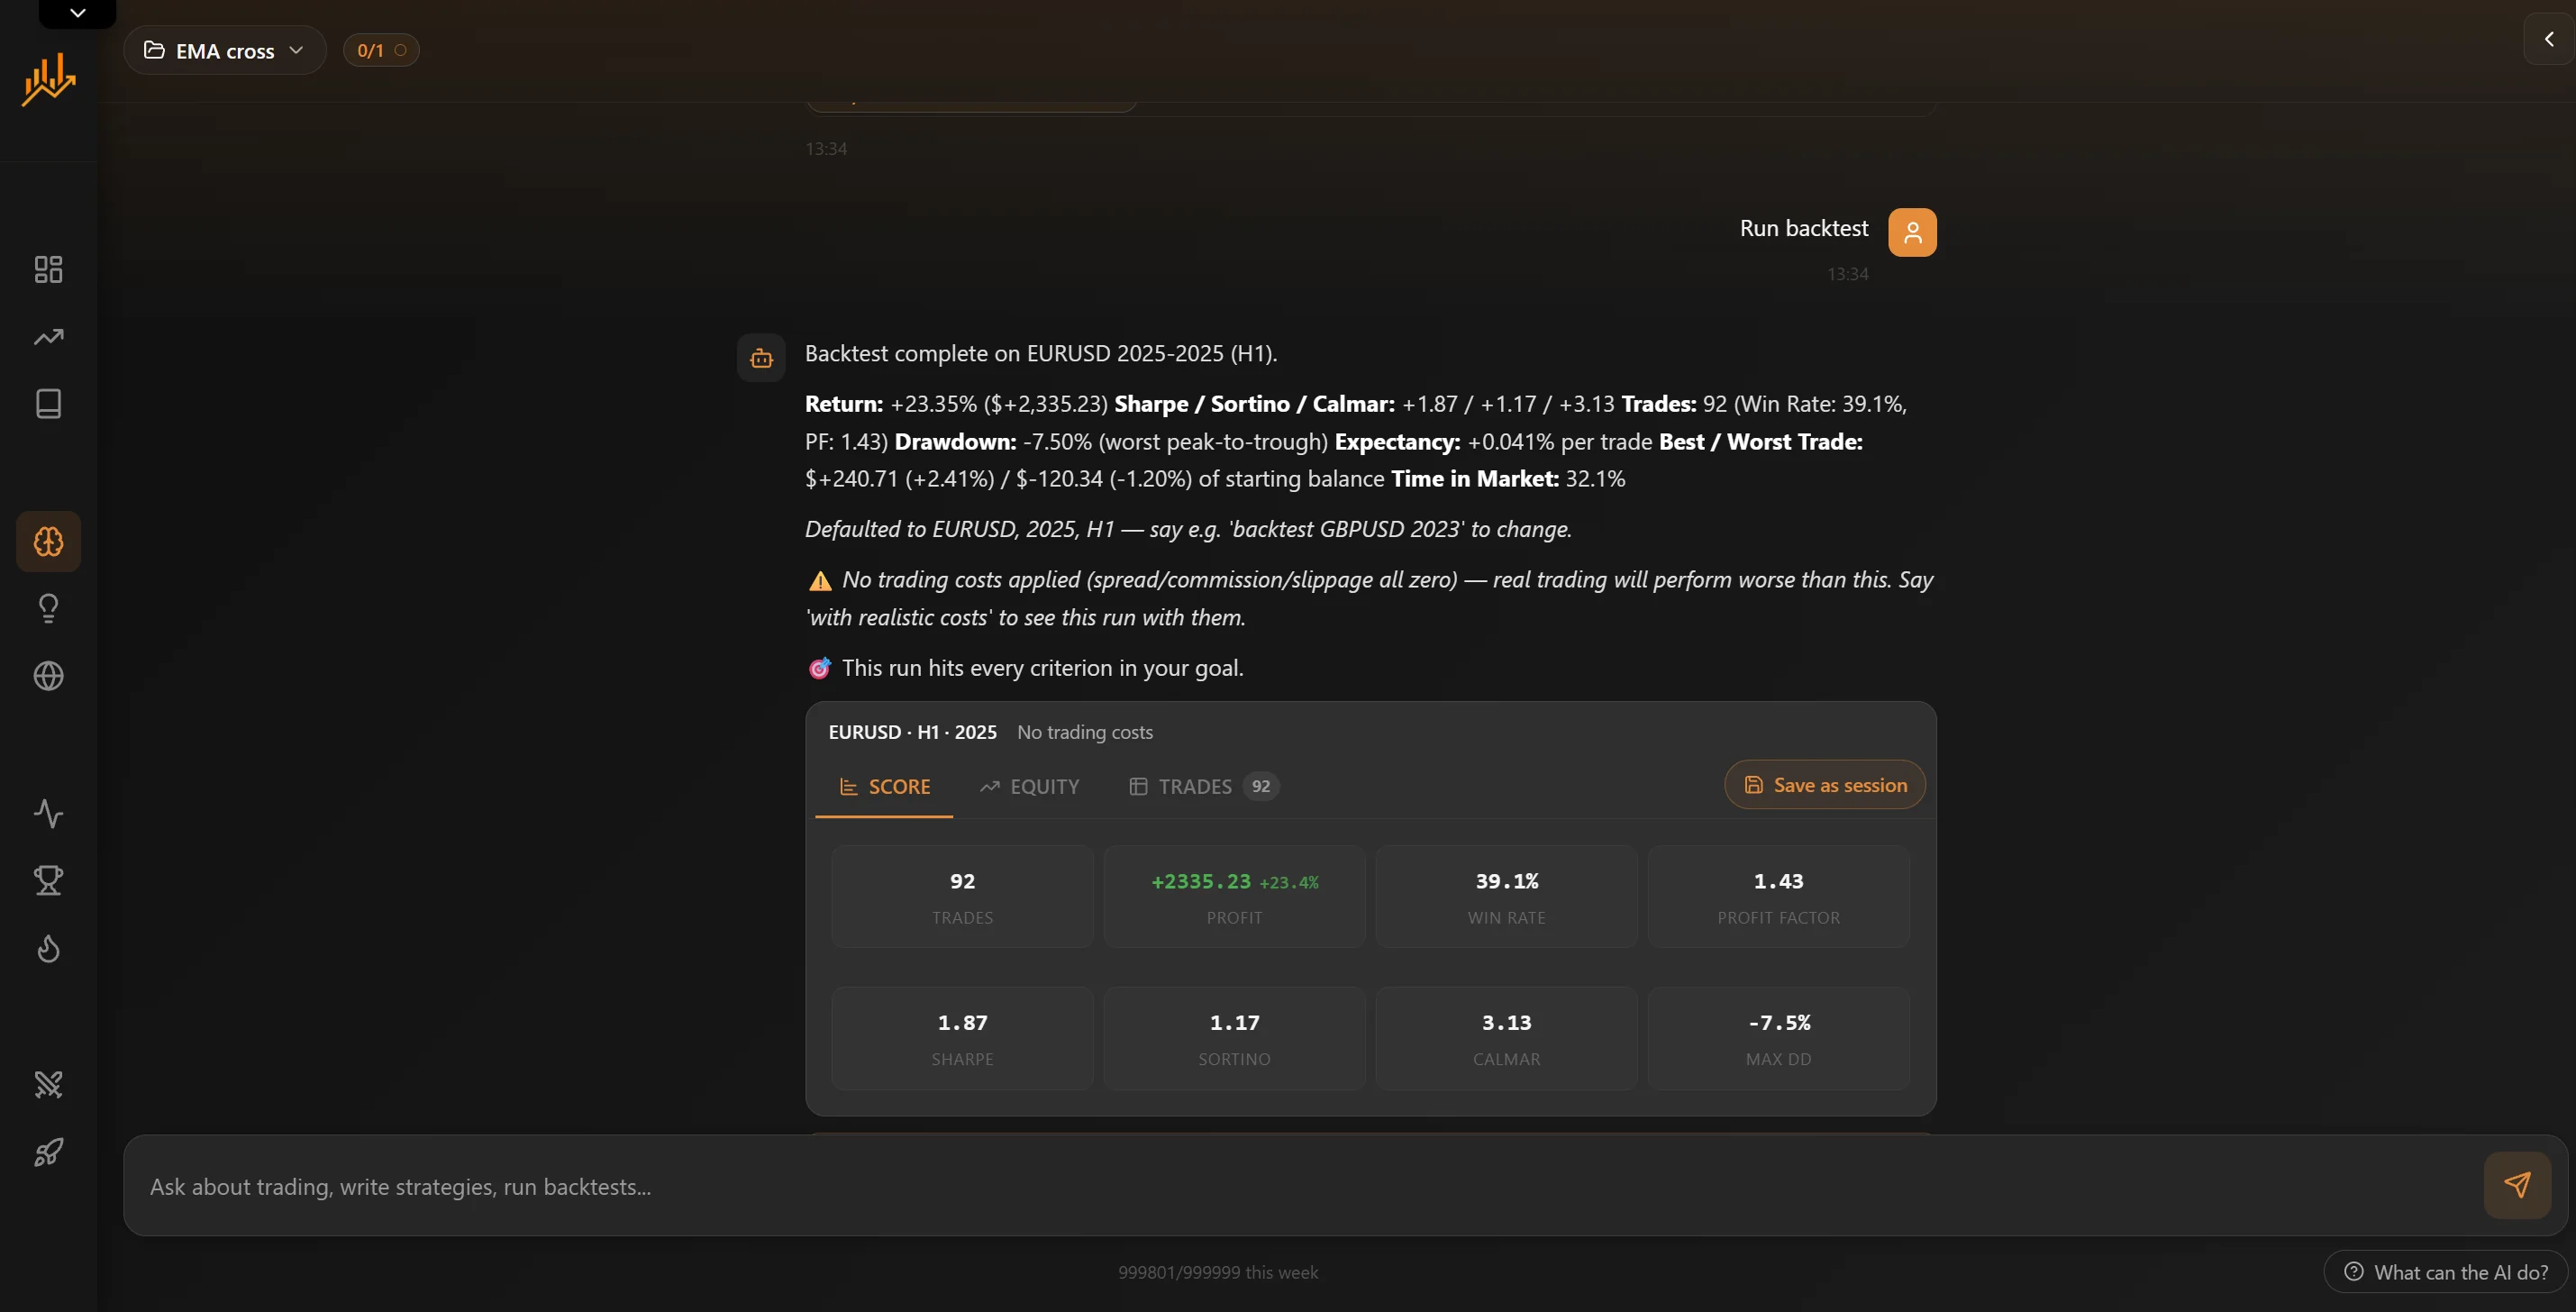 Automated
Or describe the rules to the AI
Write the strategy in plain English. The AI turns it into code, runs it on years of 1-minute history and returns the profit factor, drawdown, equity curve and every trade.
- No code to write
- Change one rule and run it again
- Monte Carlo and optimization built in
Backtest by market
What you can test on each market, and how far back the data goes.
Free Forex backtesting 61 pairs and gold · data from 2003 · free See what you can test Premium Futures backtesting NQ, ES, micros, gold and crude · Premium See what you can test Premium Crypto backtesting 50 coins vs USDT · data from 2017 · Premium See what you can test Premium Stock backtesting 52 stocks, 29 ETFs, 22 indices · Premium See what you can testPracticing for a prop firm? Try the prop firm simulator, free
Backtesting questions
What is backtesting in trading?
Backtesting is testing a trading strategy on historical prices: you apply its rules to past charts and record every trade they would have made. It shows how often the strategy won, how much it made or lost and how deep its losing streaks got, before you risk money on it.
How many trades do I need in a backtest?
At least 100, and more is better. With fewer trades, luck can explain the result. We do not judge any test with fewer than 100 trades.
How many years of data should I use?
Several years with different market conditions, and keep the most recent ones unseen while you build. Our tests use between 6 and 19 years, depending on how much history the market has, and keep the last 2 to 7 years for the final check.
Is manual or automated backtesting better?
Neither on its own. Automated testing tells you quickly whether a rule set has an edge over thousands of trades. Manual replay tells you whether you can actually trade it. Many traders test automatically first, then replay by hand.
Can I backtest for free?
Yes. BacktestingMax is free for forex and metals with unlimited sessions over the most recent 12 months, and its AI can test a strategy from a plain-English description. Premium opens every market and the full history.
Can I backtest on TradingView for free?
TradingView's free plan has bar replay on daily and higher charts. Intraday replay needs a paid plan, and automated tests are written in Pine Script.
Does a good backtest mean a strategy will work live?
No. It means the strategy worked on the past data you tested. Holding up on years it never saw, on other markets and in a Monte Carlo test makes it more believable. Trade it small before trading it big.
Choosing a tool? Compare 10 backtesting tools
Backtest your first strategy for free
Pick a market and a date and trade it bar by bar, or describe the rules and let the AI test them. No credit card, nothing to install.
Backtest a strategy freeEvery number comes from our own published backtests on 1-minute data, after costs, with 1% of the account risked per trade. Past results do not guarantee future results.