Analysis
Score every session and trade, replay your decisions bar by bar, and get data that tells you exactly what to fix.
 Feature 01
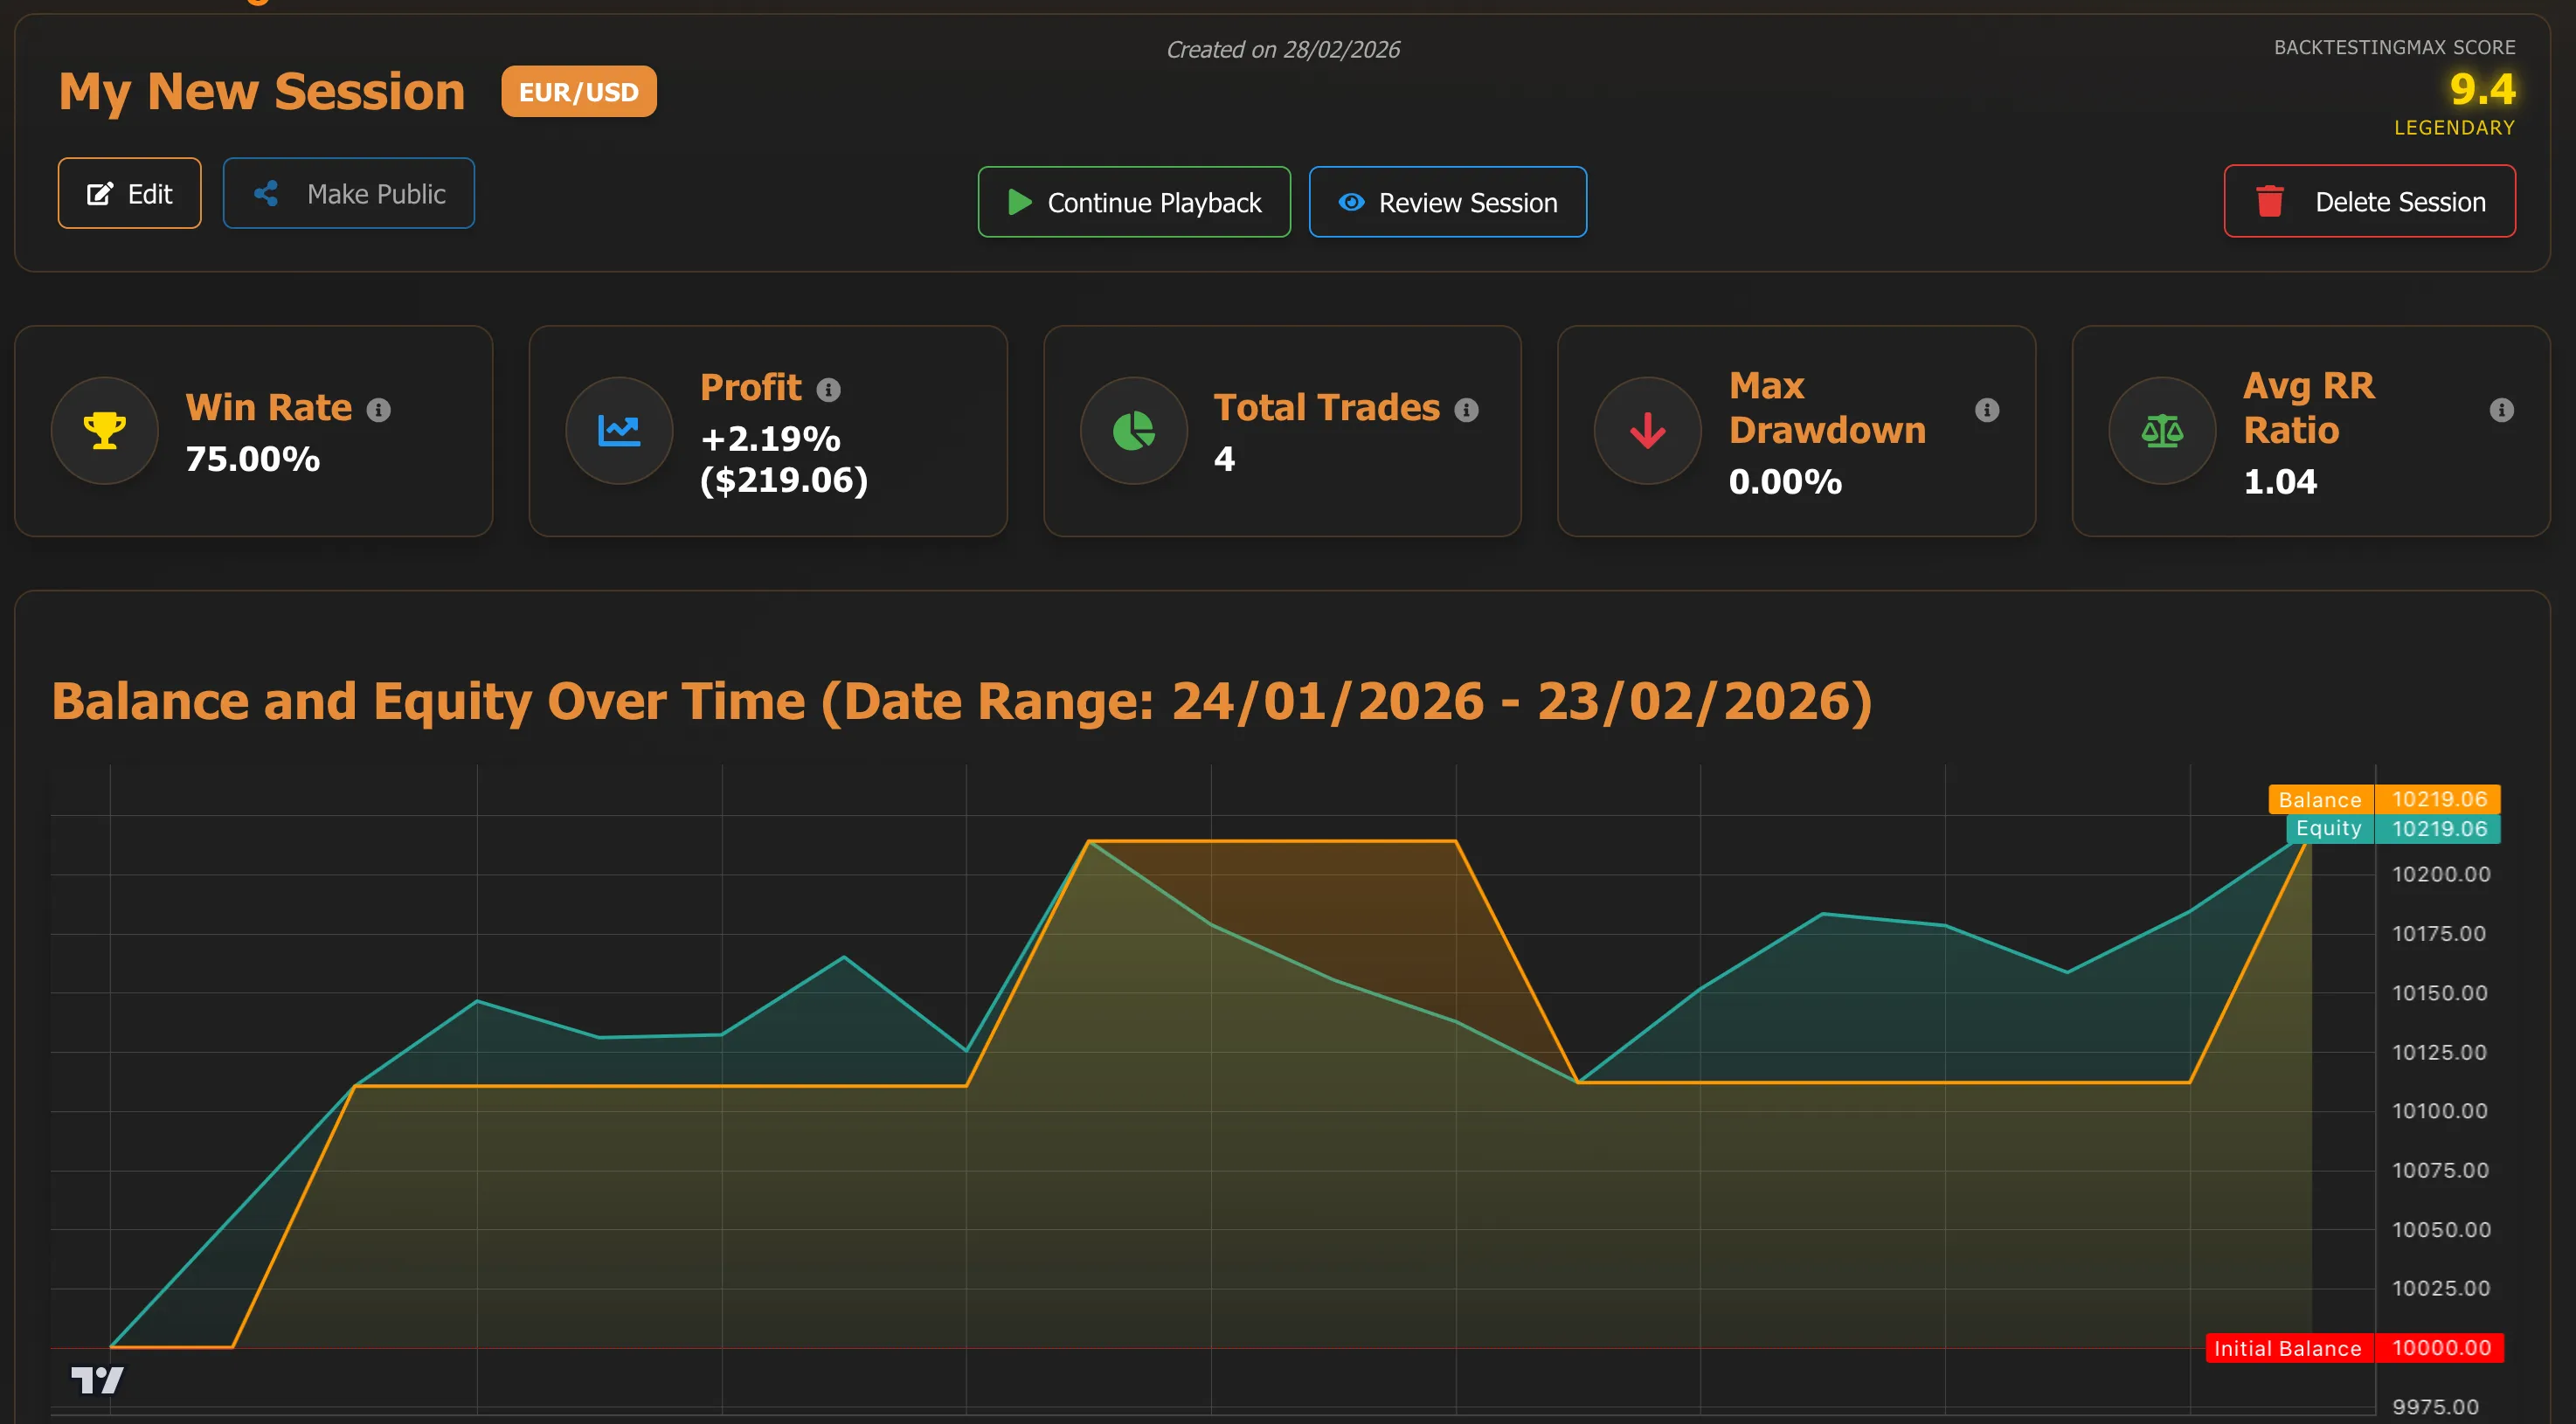
BacktestingMax Score
Every session, strategy, and individual trade gets scored. Sessions are rated across 5 pillars — Safety, Reliability, Discipline, Profitability, and Consistency — with tier classifications from "Gambler" to "Legendary" and an AI-generated critique targeting your weakest area. Each trade is scored 0–10 across 5 weighted factors: risk-reward quality, volatility conditions, entry timing, risk management, and SL/TP placement — with actionable improvement suggestions per factor.
- 5-pillar session score with radar chart and tier classification
- Per-trade score across 5 weighted factors with improvement tips
- AI-generated critique targeting your weakest pillar
- Scoring across sessions, strategies, and individual trades
 Feature 02
Strategy Optimization
See exactly when, where, and how you trade best. Day-of-week win rate heatmaps, long vs short bias analysis, per-asset letter grades (A–F), streak analysis, and AI-generated suggestions like "Your best day is Tuesday — consider focusing more activity there."
- Day-of-week and time-of-day win rate heatmaps
- Long vs short directional bias analysis
- Per-asset performance letter grades (A–F)
- AI-generated optimization suggestions
 Feature 03
Equity Curve & Drawdown Monitoring
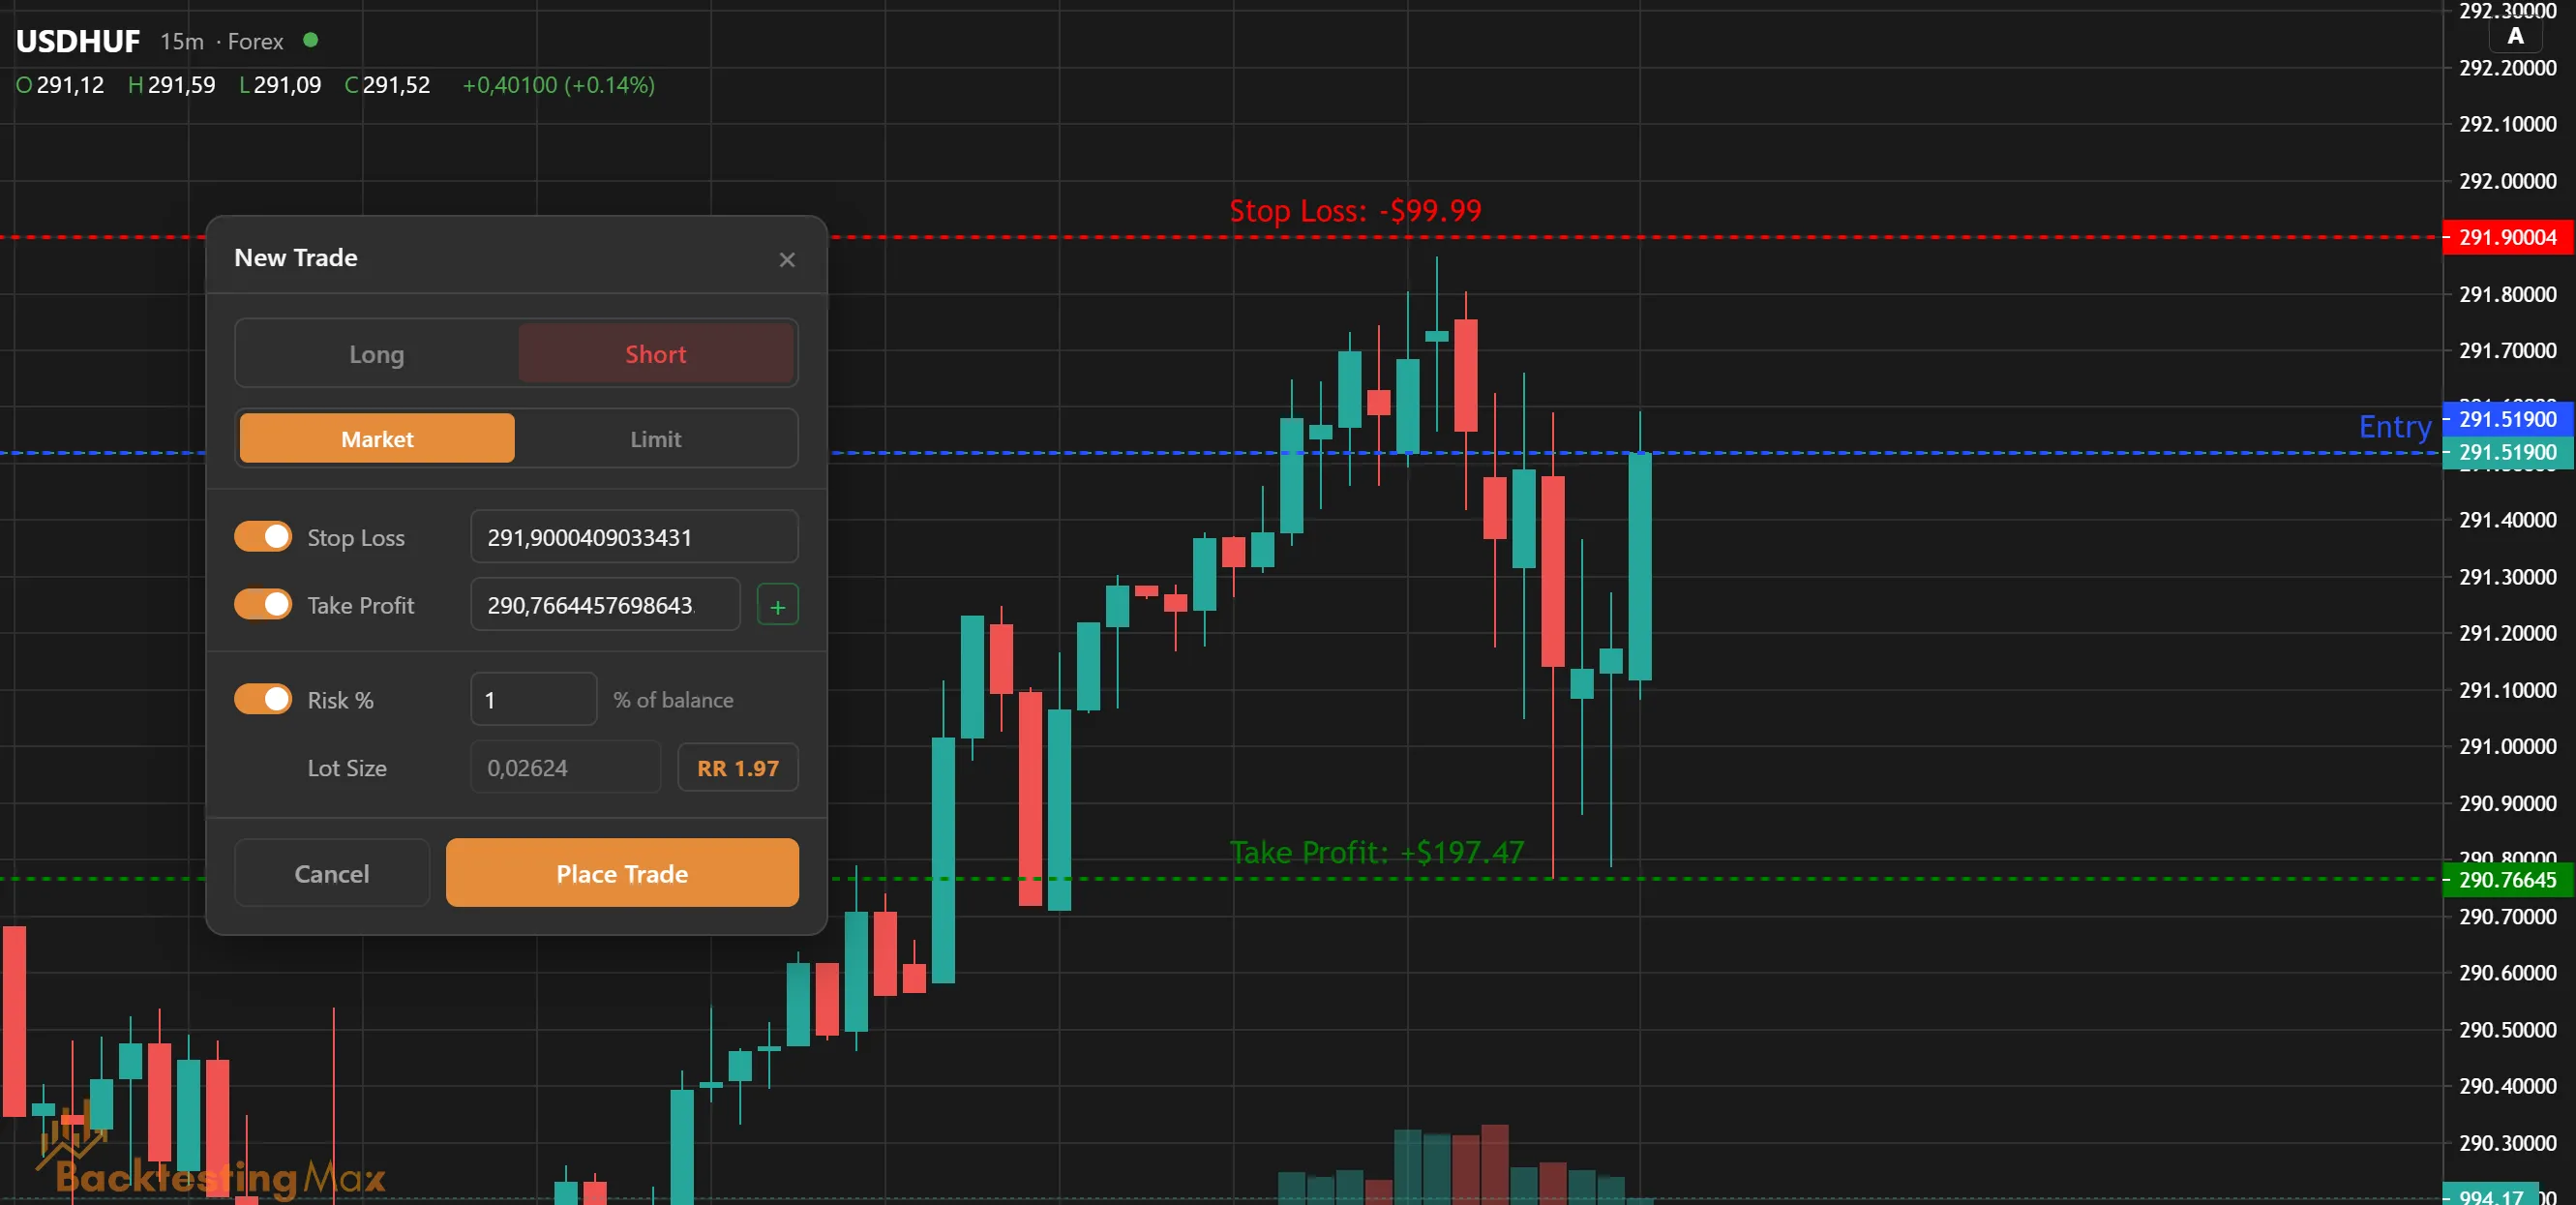
Real-time equity curve as you trade, plus prop firm-grade drawdown tracking. In prop firm challenge mode the profit target, the daily loss and the max loss, static or trailing, are checked at every step, and the session ends with a pass or fail. Track max drawdown depth, recovery time, and winning/losing streak detection.
- Real-time equity curve during backtesting
- Prop firm-grade daily loss and max loss limits, static or trailing
- Pass or fail verdict the moment a rule is broken
- Max drawdown depth, recovery time, and streak detection
Feature 04
Performance Dashboard
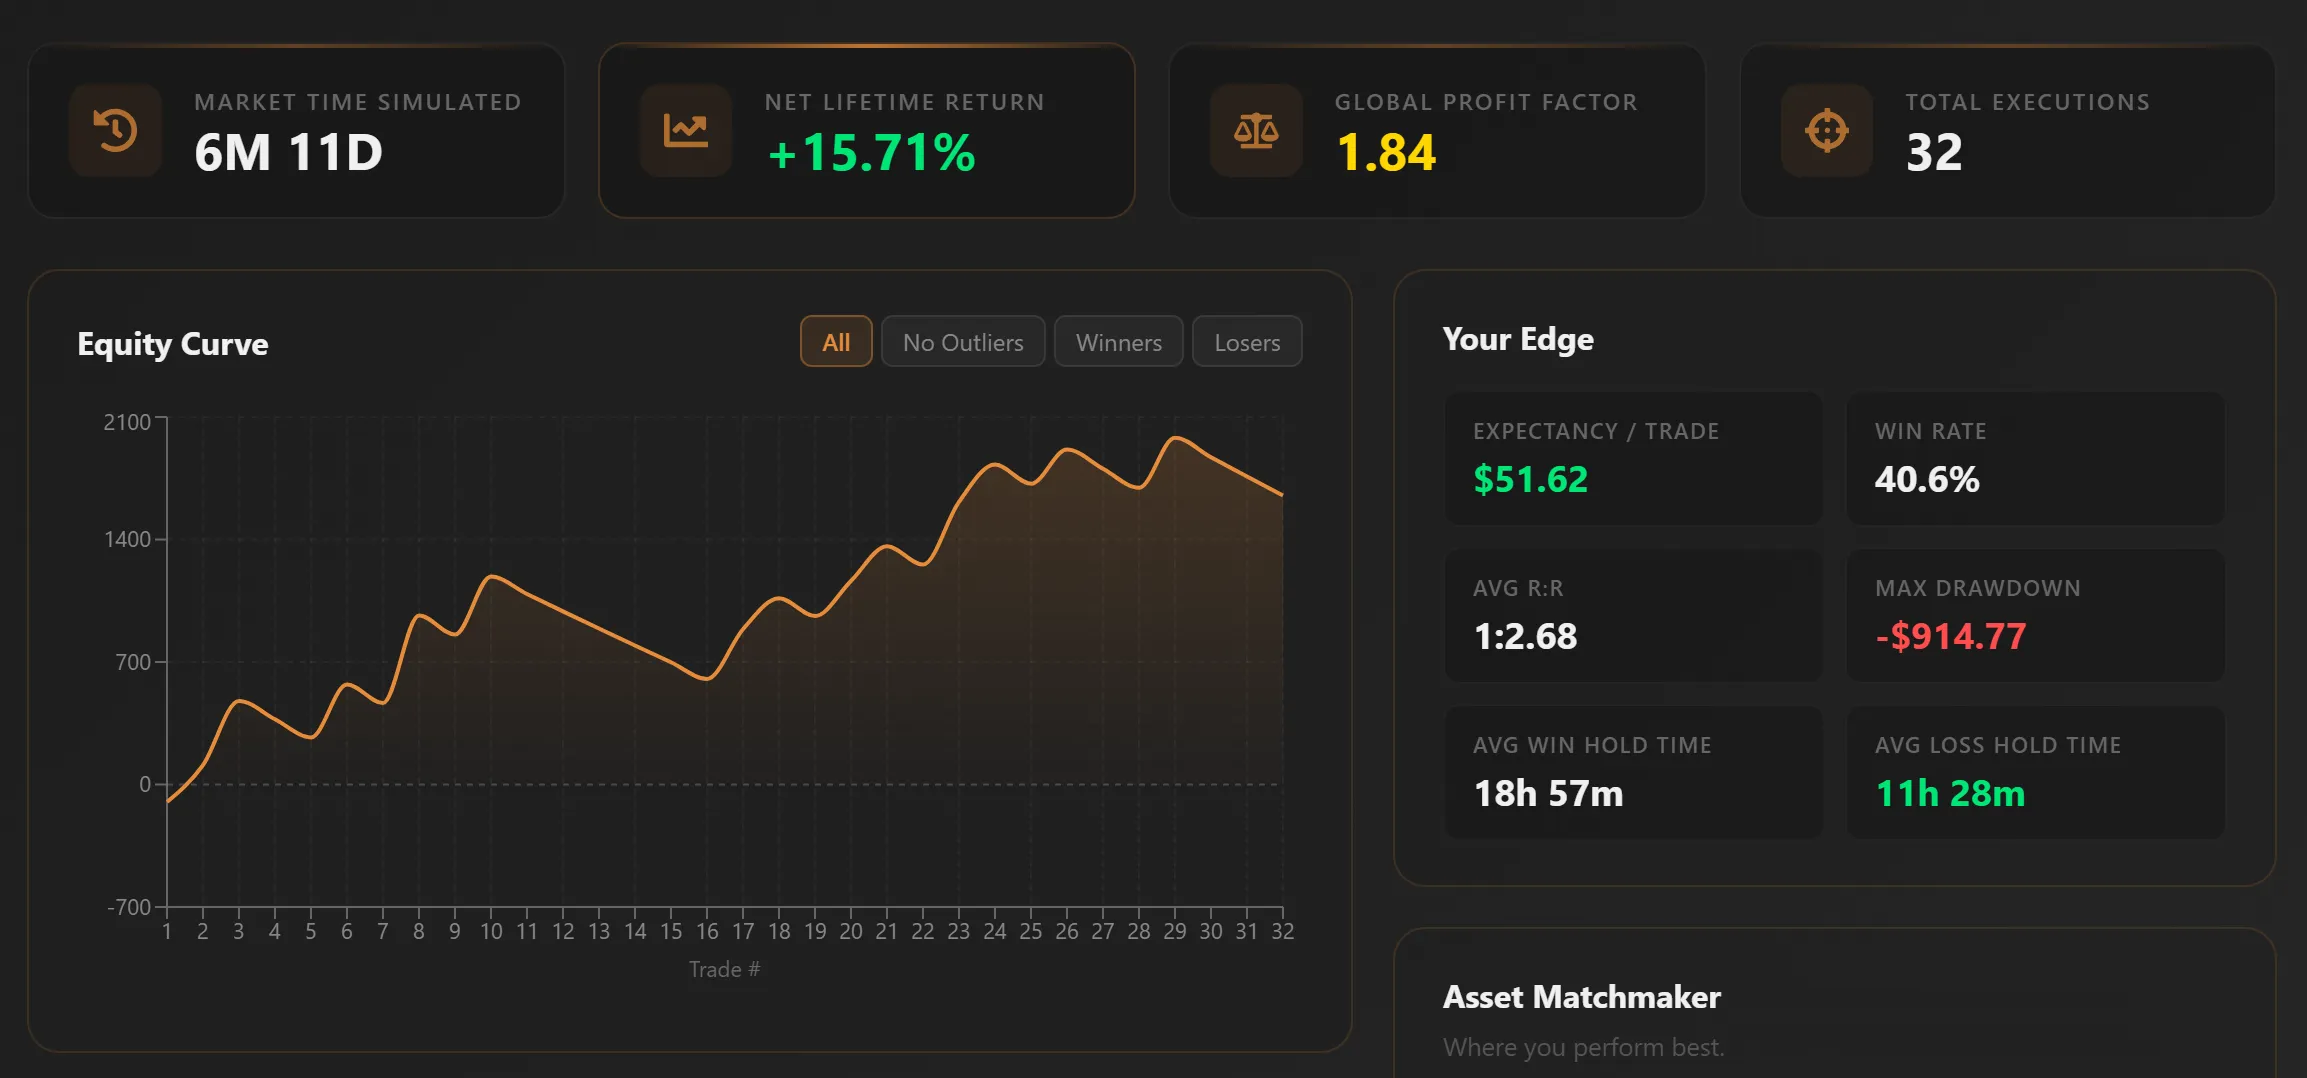
30+ metrics filterable by strategy, asset, and time period. Win rate, profit factor, Sharpe ratio, expectancy, consistency score, risk score, average hold times, long vs short P&L — all in one view. Assets ranked with letter grades so you instantly see where your edge is strongest.
- 30+ metrics: win rate, profit factor, Sharpe, expectancy, and more
- Filter by strategy, asset class, and time period
- Asset performance ranking with letter grades
- Long vs short P&L and average hold time breakdown
 Feature 05
Trade Review & Replay
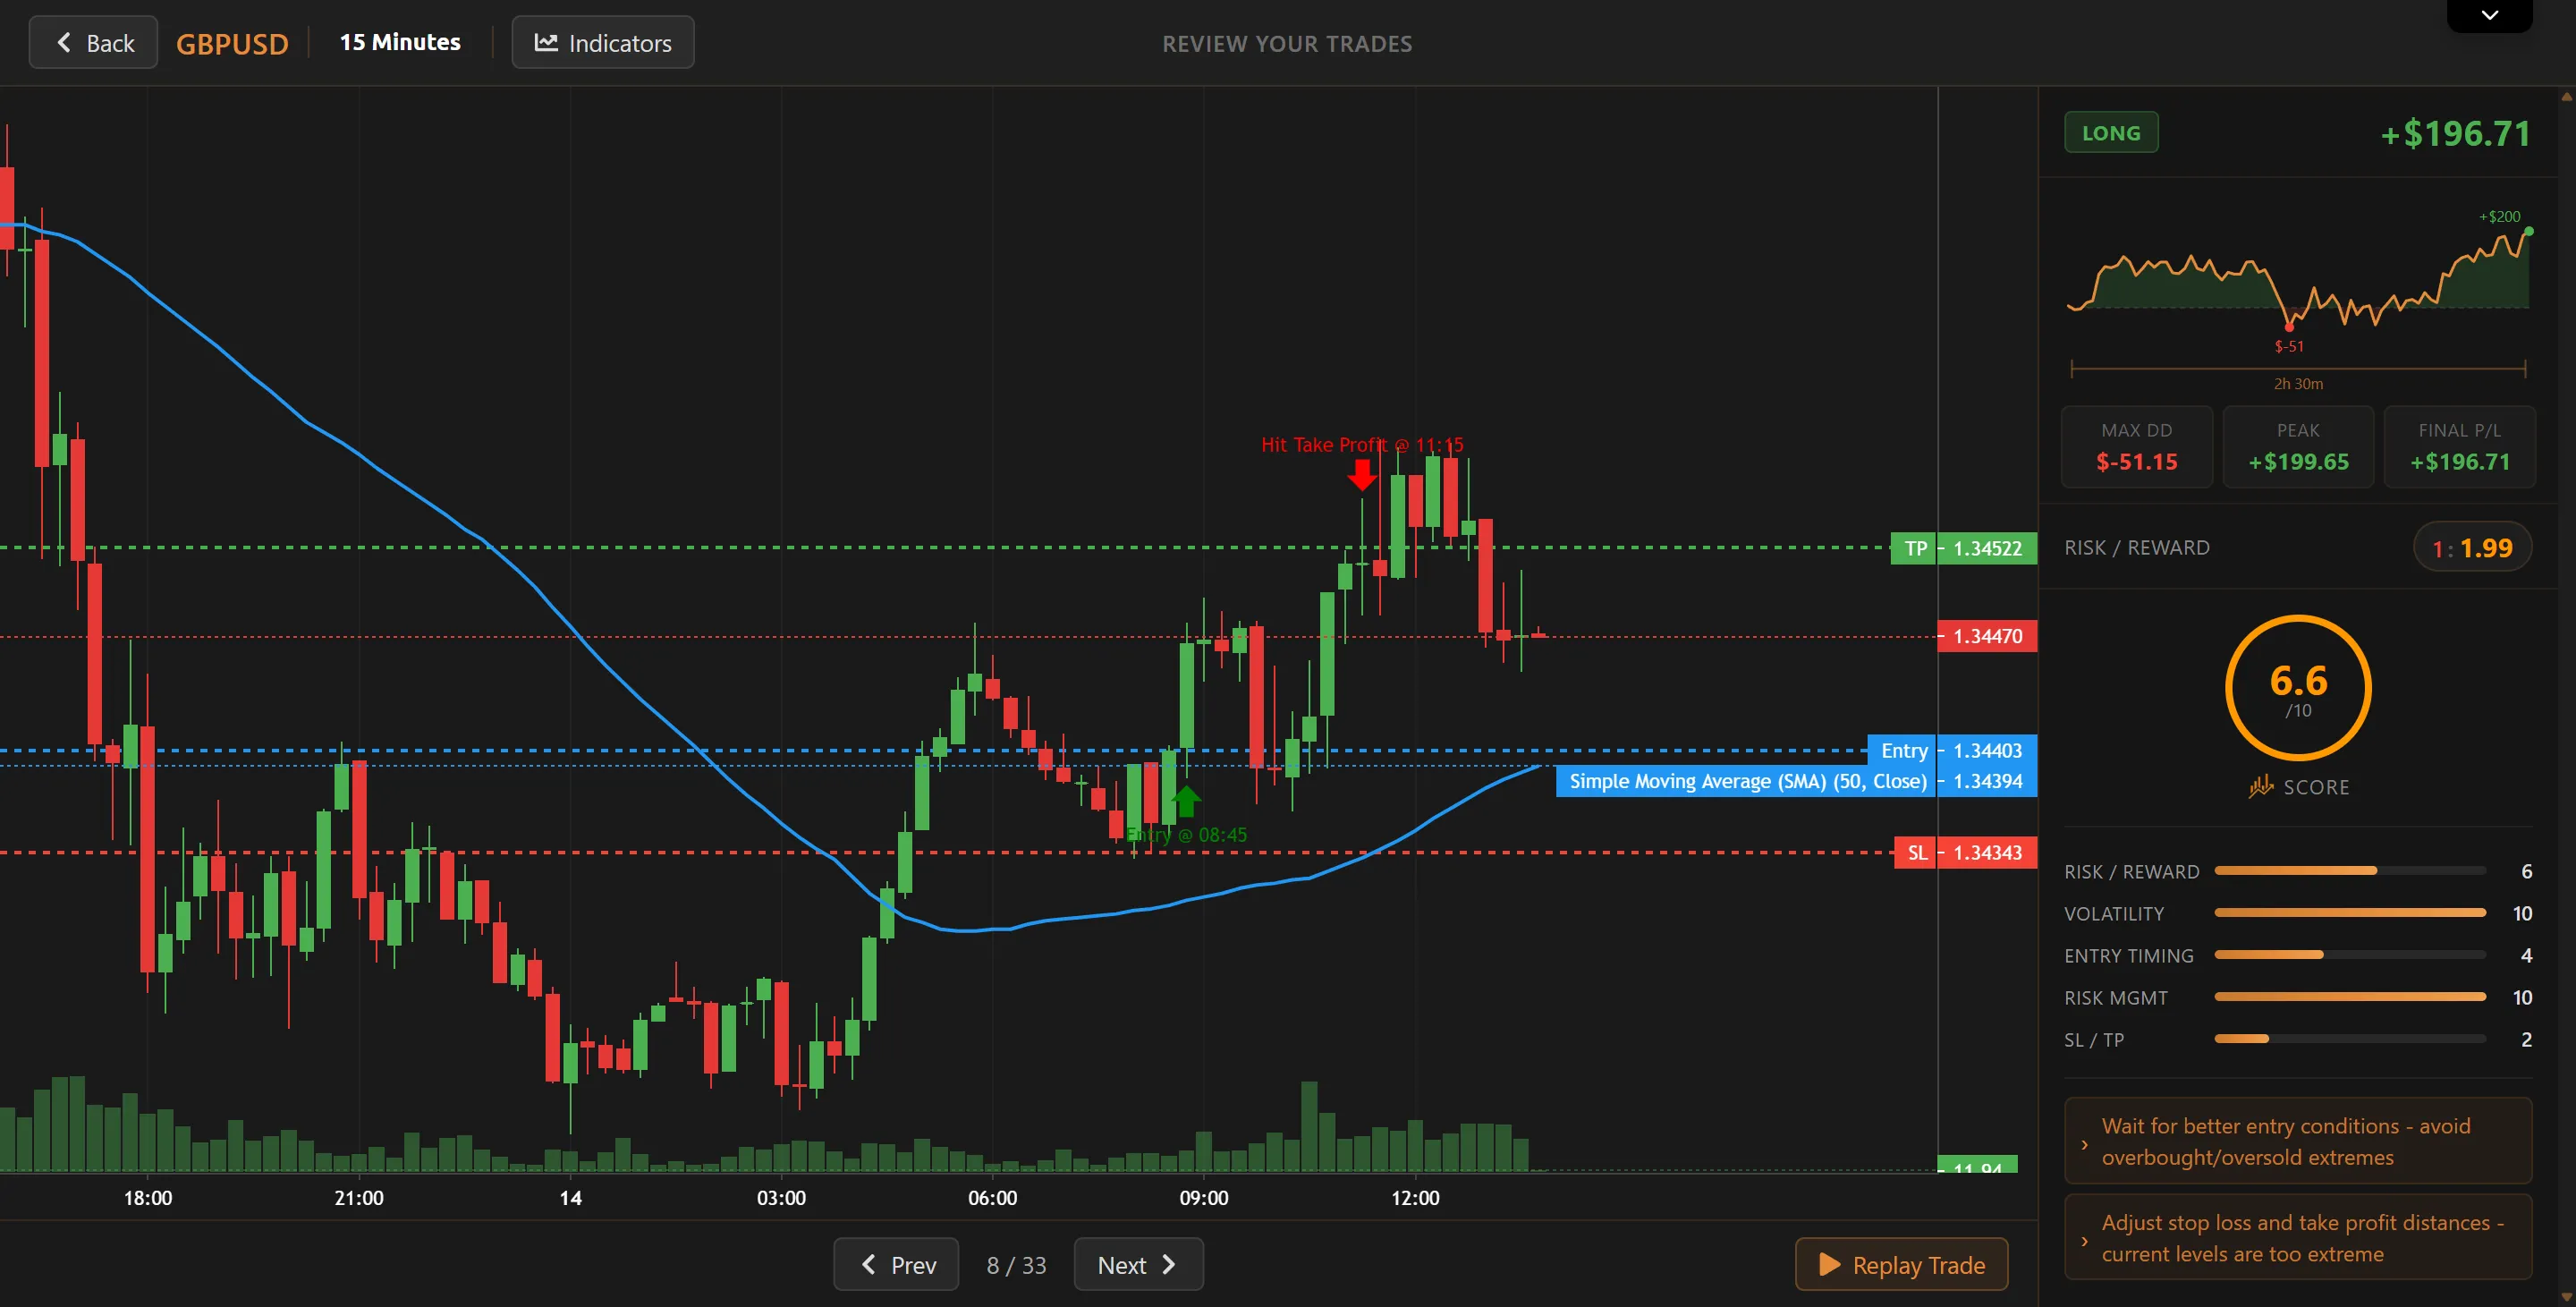
Step through every trade one by one with full chart context. Each trade auto-loads the optimal timeframe, shows entry/exit markers with SL/TP levels, and displays a real-time equity curve of how P&L moved during the trade. Enter Replay Mode to rewind before your entry and watch the setup unfold bar by bar — so you can study what you saw vs what you should have seen.
- Navigate trades with arrow keys — full chart context per trade
- Replay Mode: rewind and watch the trade develop bar by bar
- Per-trade equity curve with peak profit and max drawdown
- Trade score breakdown with improvement suggestions
More Analysis Features
Deep metrics and statistical tools for serious performance review.
Monte Carlo Simulation
Stress-test your strategy across thousands of randomized trade sequences.
Correlation Matrix
Identify hidden risk concentration across strategies and assets.
Discipline & Adherence Tracking
Win rate by checklist compliance, most skipped rules, discipline trend.
R-Multiple Distribution
Visualize your risk efficiency and reward distribution over time.
Long vs Short Breakdown
Directional bias with separate win rates and P&L.
Statistical Confidence Levels
Know when your sample size actually means something — 10 trades vs 300.
Hold Time Analysis
Compare how long you hold winners vs losers.
Streak Analysis
Longest win/loss streaks with current streak status.
Session Comparison
Compare performance across different backtest sessions.
Prop Firm Challenge Mode
Real rule sets from 16 firms, trailing drawdown, and a pass or fail verdict.