Journaling
Log trades, track your psychology, and build a searchable record of everything you've learned — so you never repeat the same mistake twice.
 Feature 01
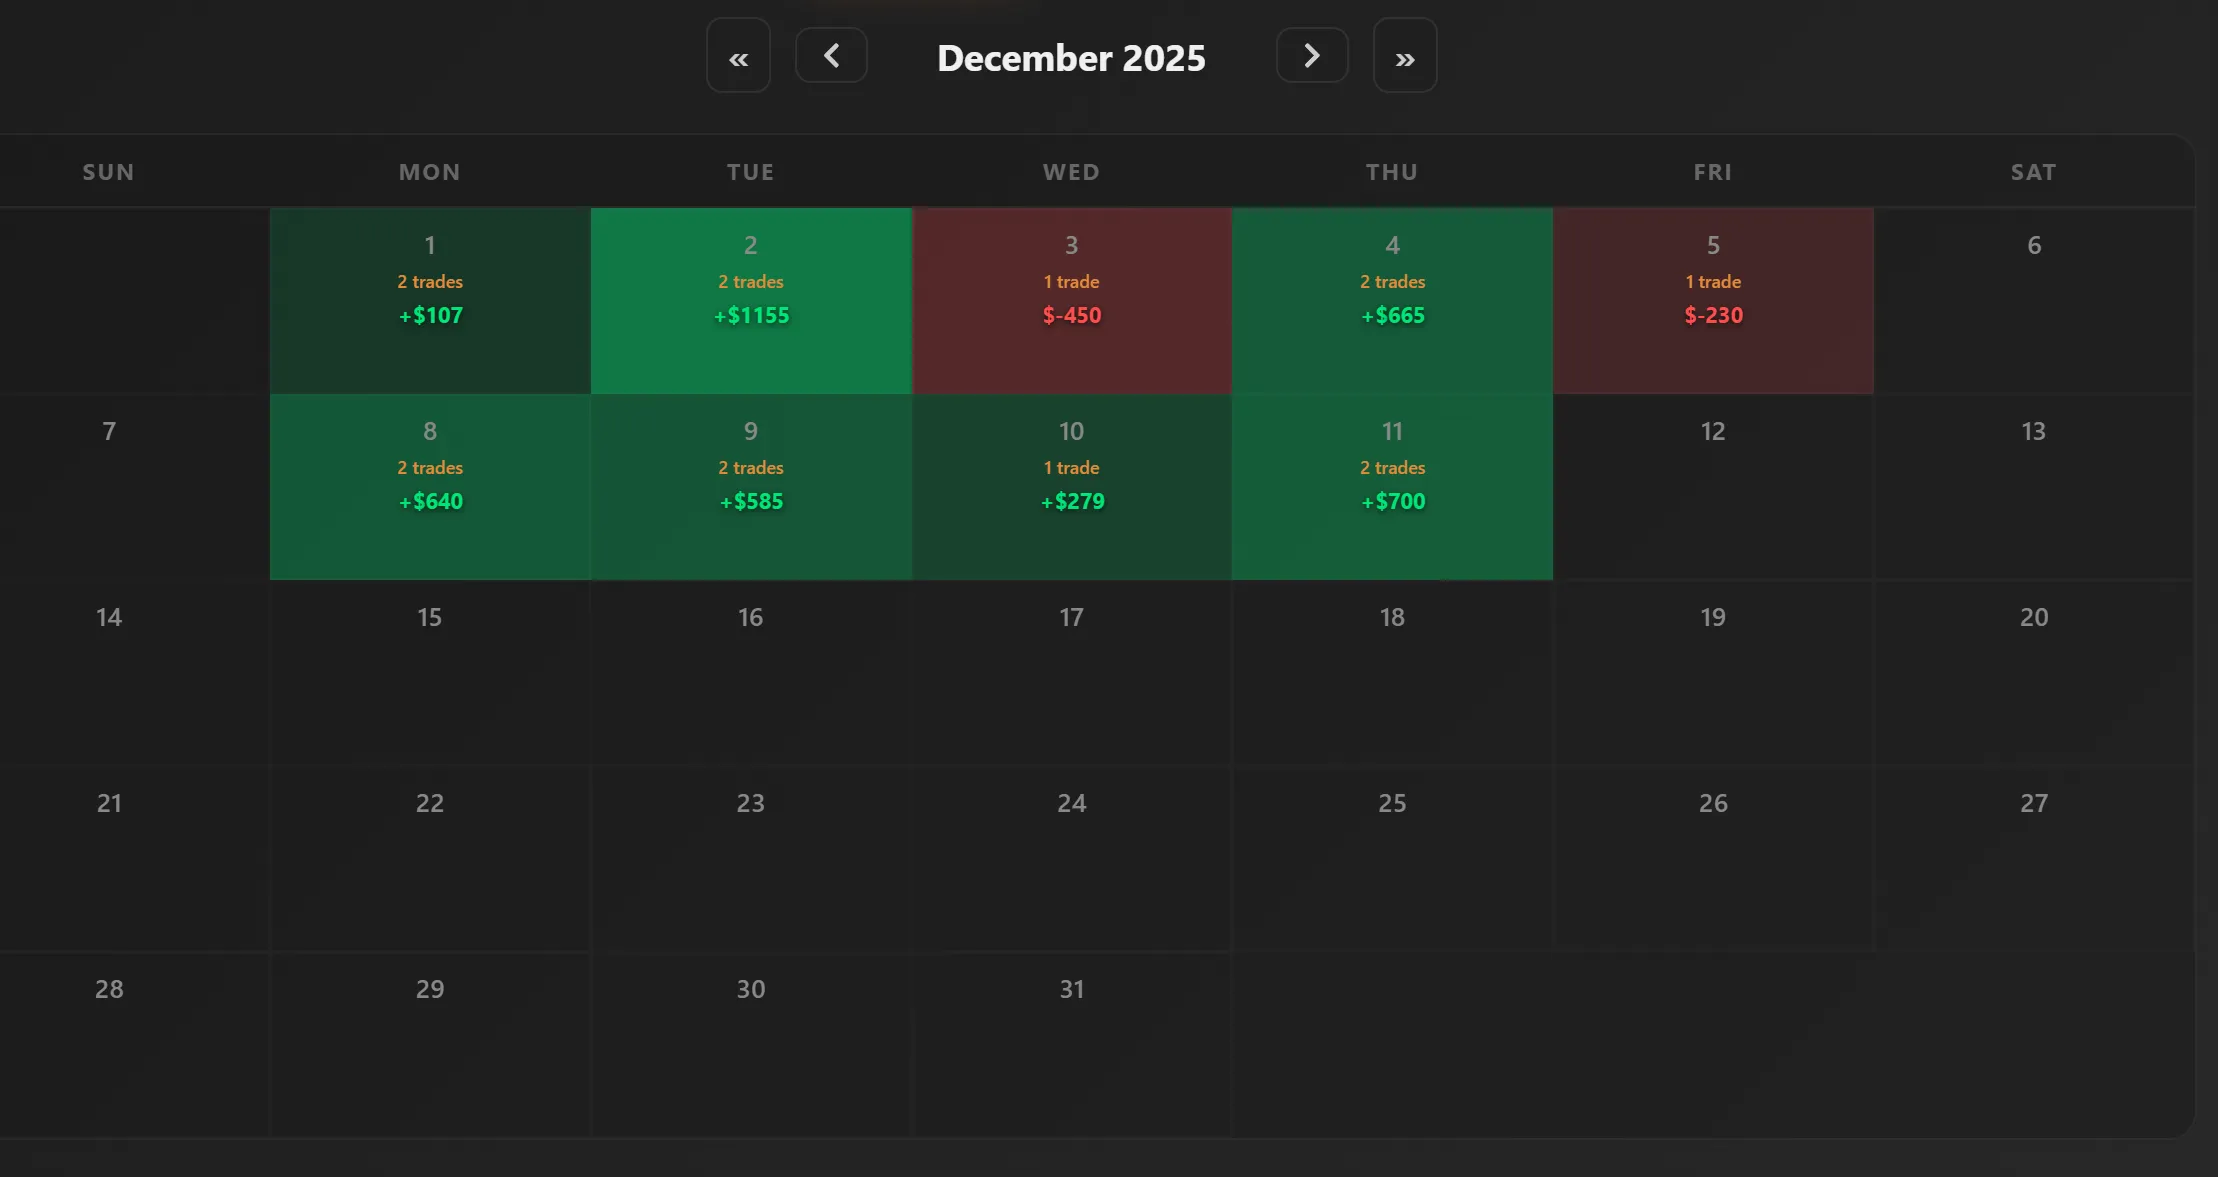
Calendar Heatmap
Your entire trading year at a glance. Color-coded daily P&L — green for wins, red for losses, intensity shows magnitude. Monthly summaries with trade count, net P&L, win rate, best and worst days. Click any day to drill into individual trades.
- Color-coded daily P&L with intensity shading
- Monthly summaries with trade count and win rate
- Best and worst day highlights per month
- Click any day to filter and drill into trades
 Feature 02
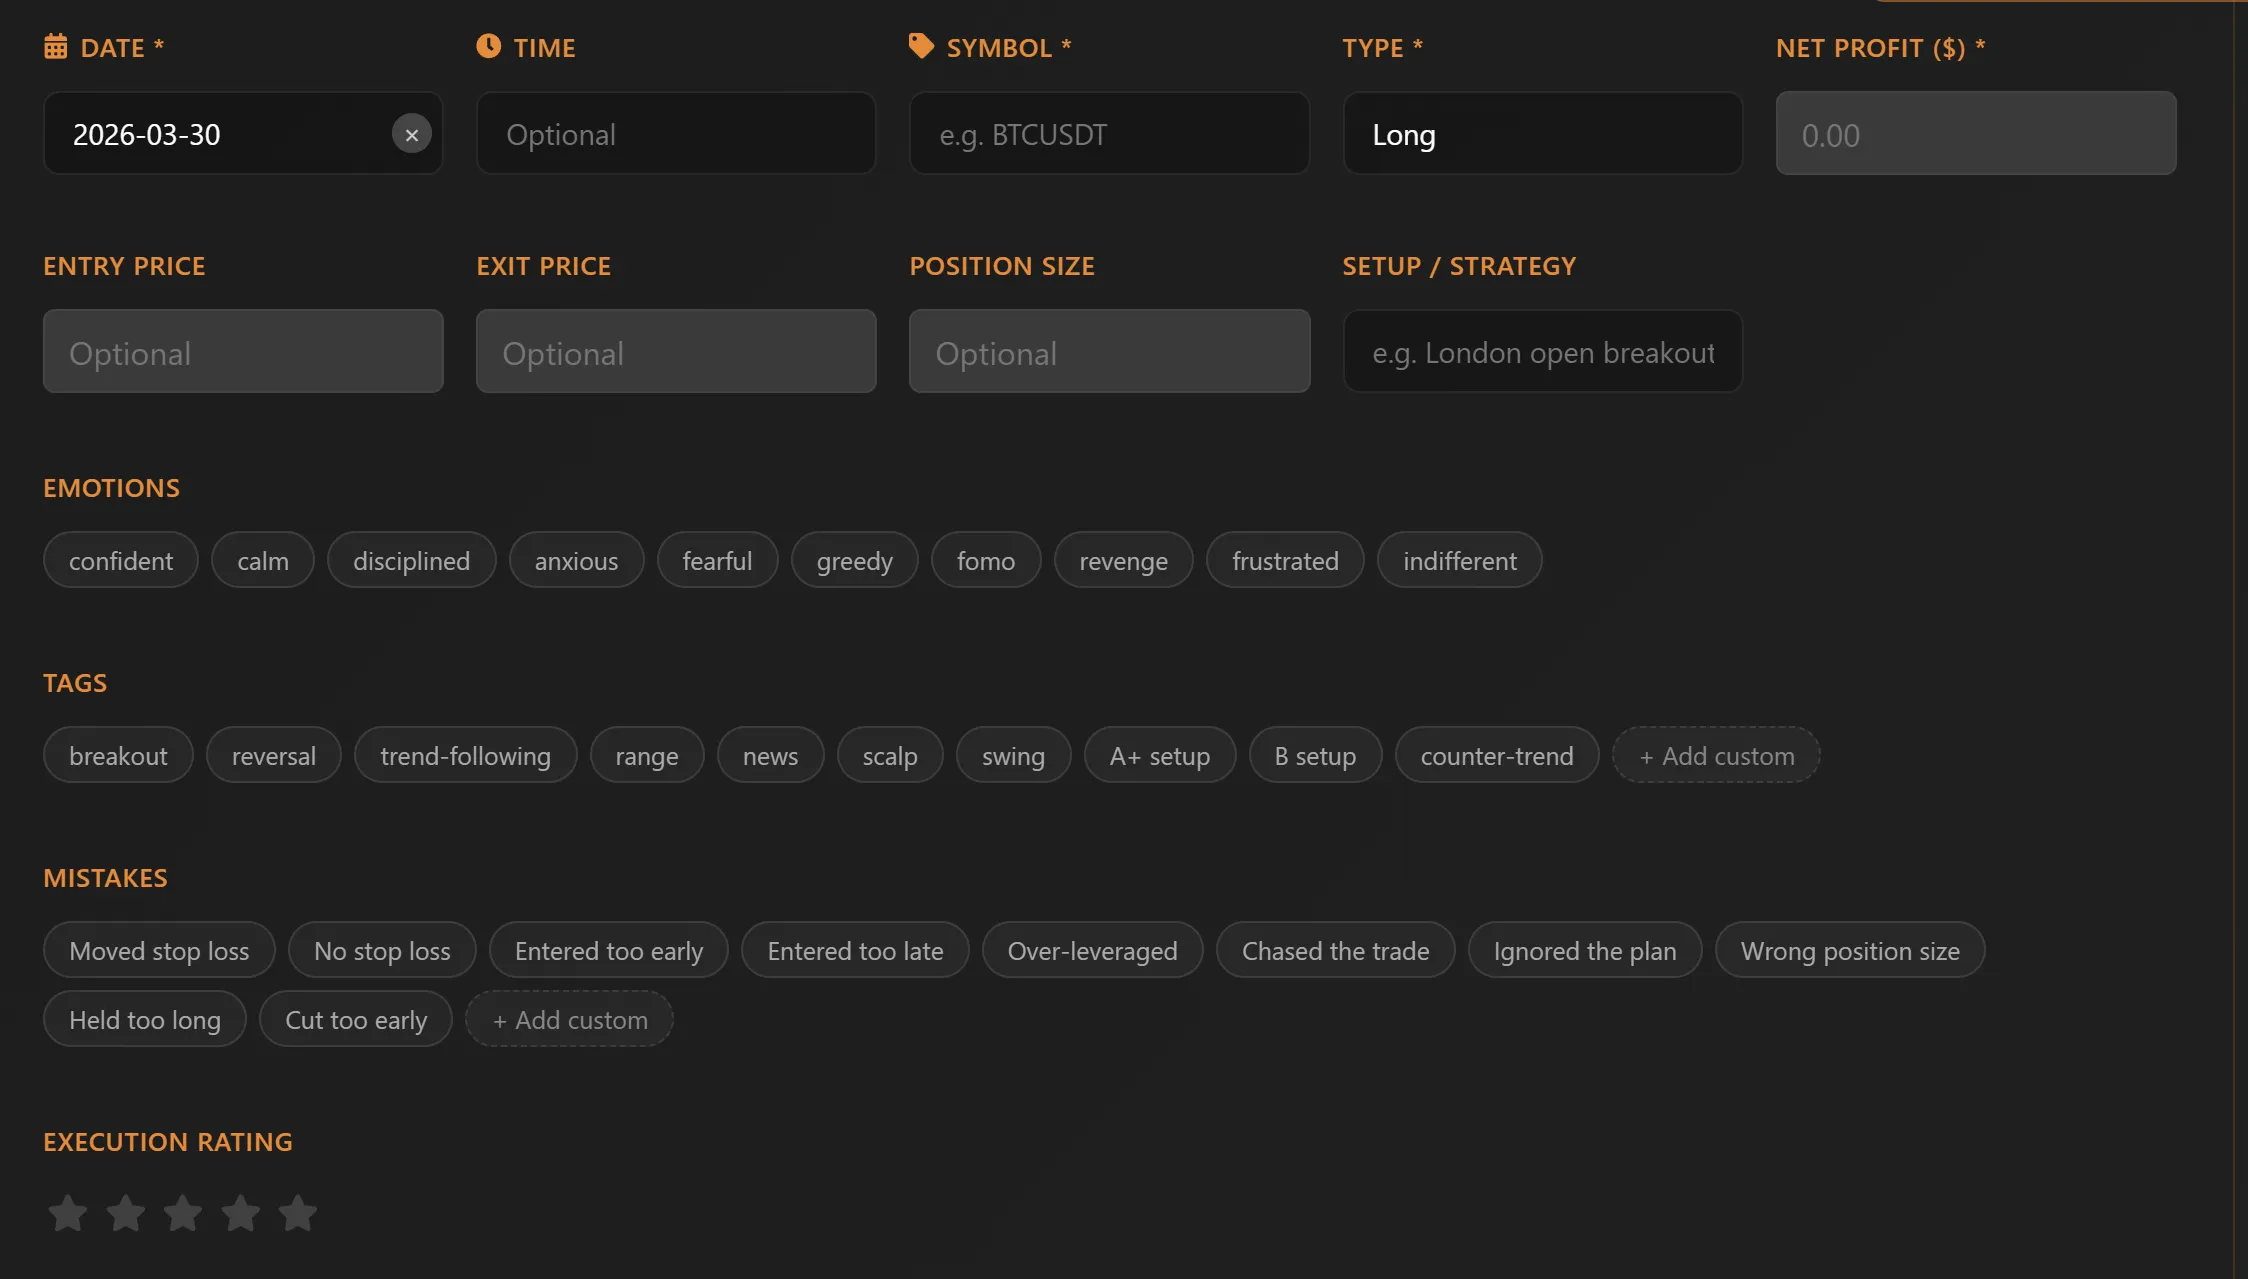
Trade Logging & Tagging
Log every trade with full clinical data: entry, exit, position size, P&L. Add custom tags (breakout, scalp, news play), emotional state, setup notes, and mistakes. Automatic capture from backtests or manual entry for external trades. Screenshots via drag-drop or clipboard paste.
- Automatic trade capture from backtests
- Manual entry for external trade history
- Custom tags for setups, strategies, and mistakes
- Screenshot attachments via drag-drop or paste
 Feature 03
Emotion & Psychology Tracking
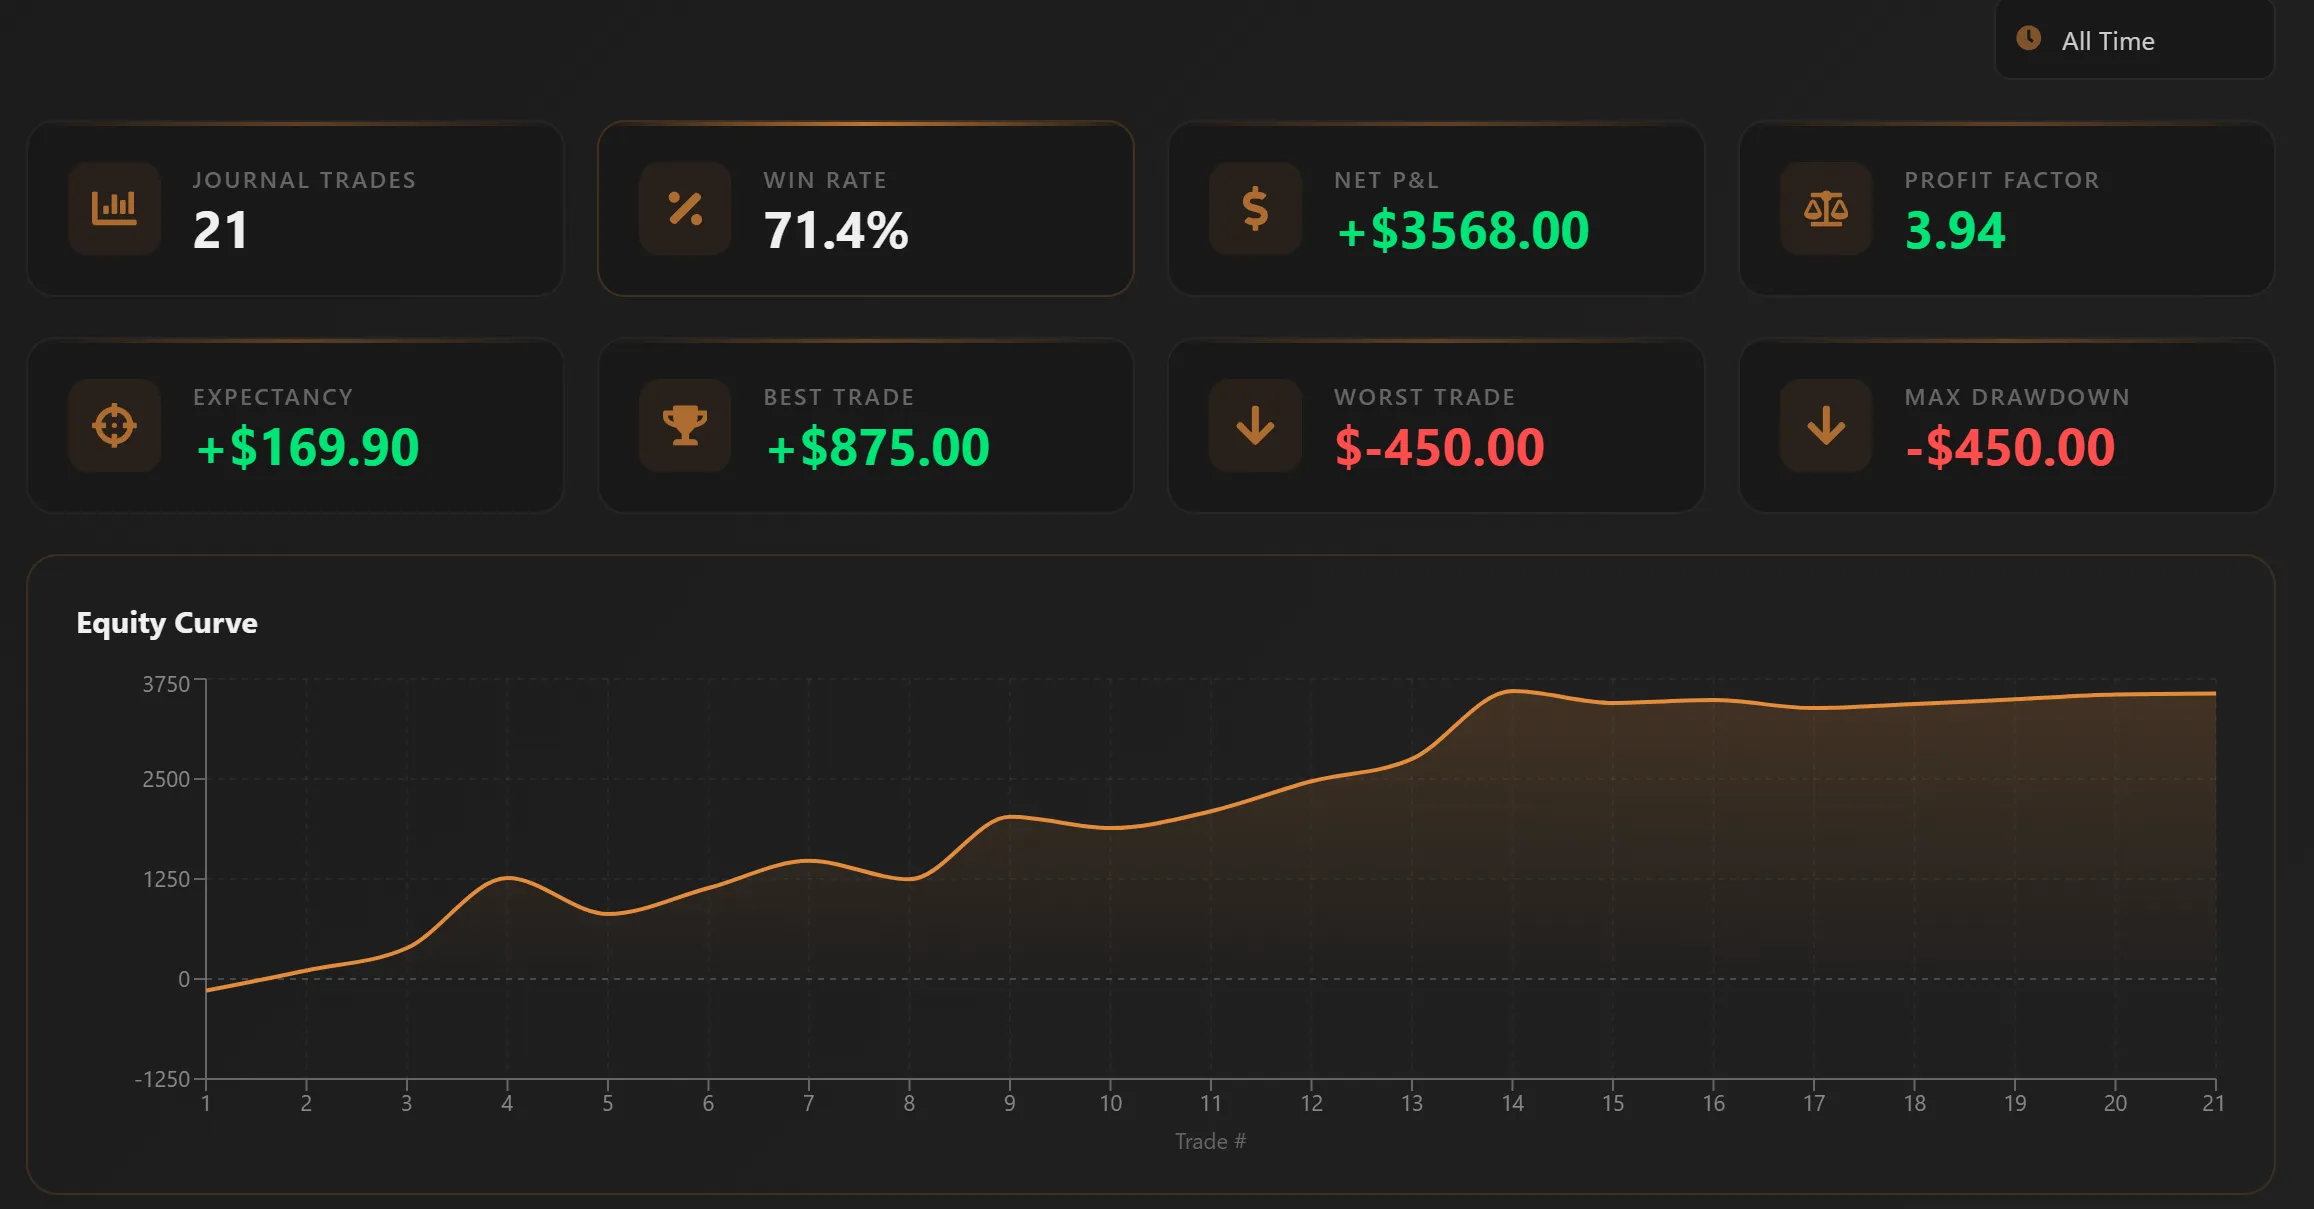
Track your mental state per trade and see exactly how it affects your bottom line. Correlation analysis between emotions and outcomes — data-backed proof of what happens when you trade scared, overconfident, or tilted. Win rate breakdown by self-rated execution quality.
- Log emotions and mental state per trade
- Mood-to-P&L correlation analysis
- Win rate breakdown by execution quality
- Data-backed proof of psychology impact
Feature 04
Session & Time Analysis
Break down your performance by trading session (Asia, London, New York), day of week, and custom tags. See which environments you thrive in and which you should avoid. Filter everything by date range: 30 days, 90 days, 1 year, or all-time.
- Asia, London, and New York session breakdown
- Day-of-week performance comparison
- Per-tag win rate and P&L analysis
- Flexible date range filtering
 Feature 05
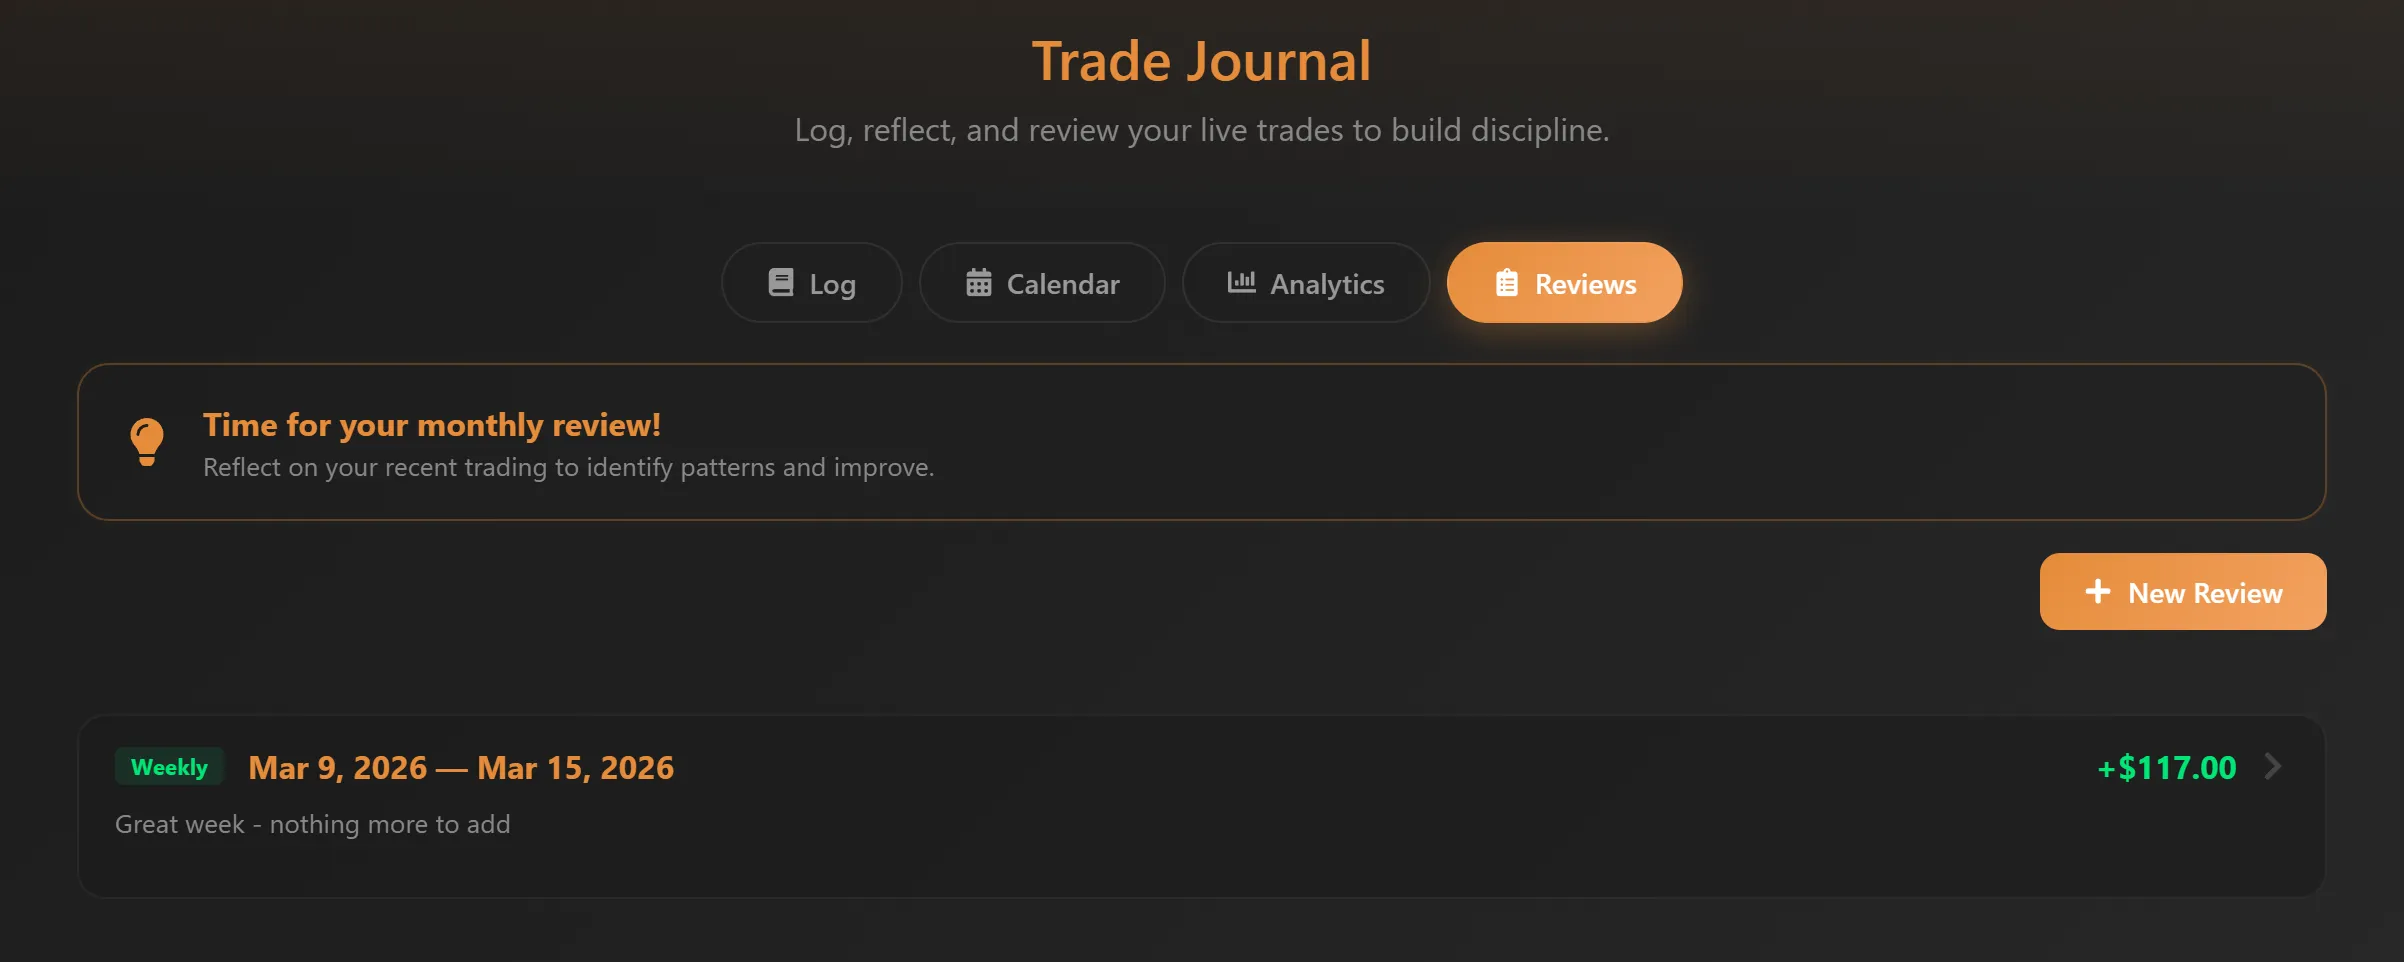
Structured Reviews
Weekly and monthly review forms with guided reflection. Categorize mistakes, capture lessons learned, and write action plans. Build a searchable archive of your growth as a trader.
- Guided weekly and monthly review forms
- Mistake categorization and lesson capture
- Action-oriented improvement plans
- Searchable archive of past reviews
 Feature 06
Import & Export
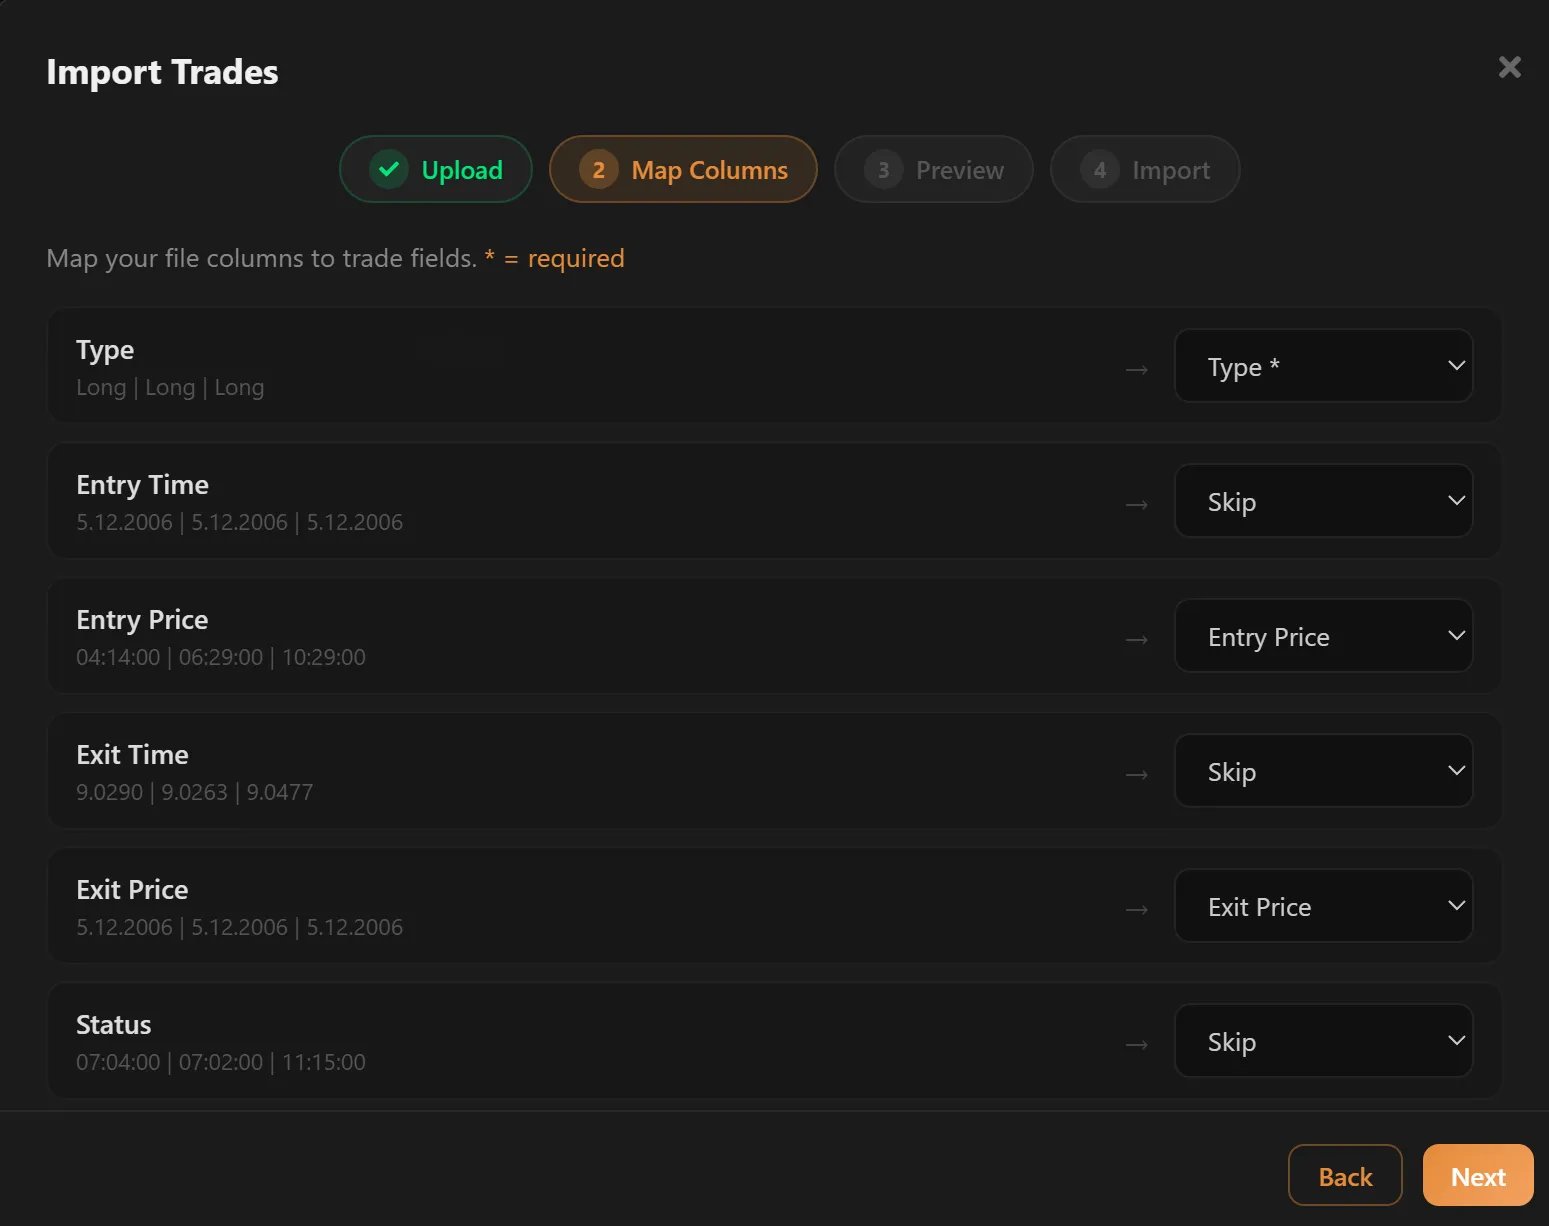
Bring your trading history from any platform. 4-step import wizard: upload CSV or JSON, auto-detect columns, preview and validate, then batch import. Export your full journal with one click.
- 4-step import wizard with auto-detection
- CSV and JSON format support
- Column mapping with live preview and validation
- One-click full journal export
More Journaling Features
Everything you need to build a complete trading record.
Session Saving
Save and resume any backtest exactly where you left off.
Screenshot Attachments
Paste or drag-drop trade screenshots with lightbox zoom.
Equity Curve
Trade-by-trade cumulative P&L visualization.
Performance by Tag
See win rate and P&L per custom tag.
Profit Factor & Expectancy
Key metrics calculated across your journal.
Streak Tracking
Current and longest win/loss streaks.
Best & Worst Trade
Instantly identify outliers.
Max Drawdown
Track your deepest equity dip.